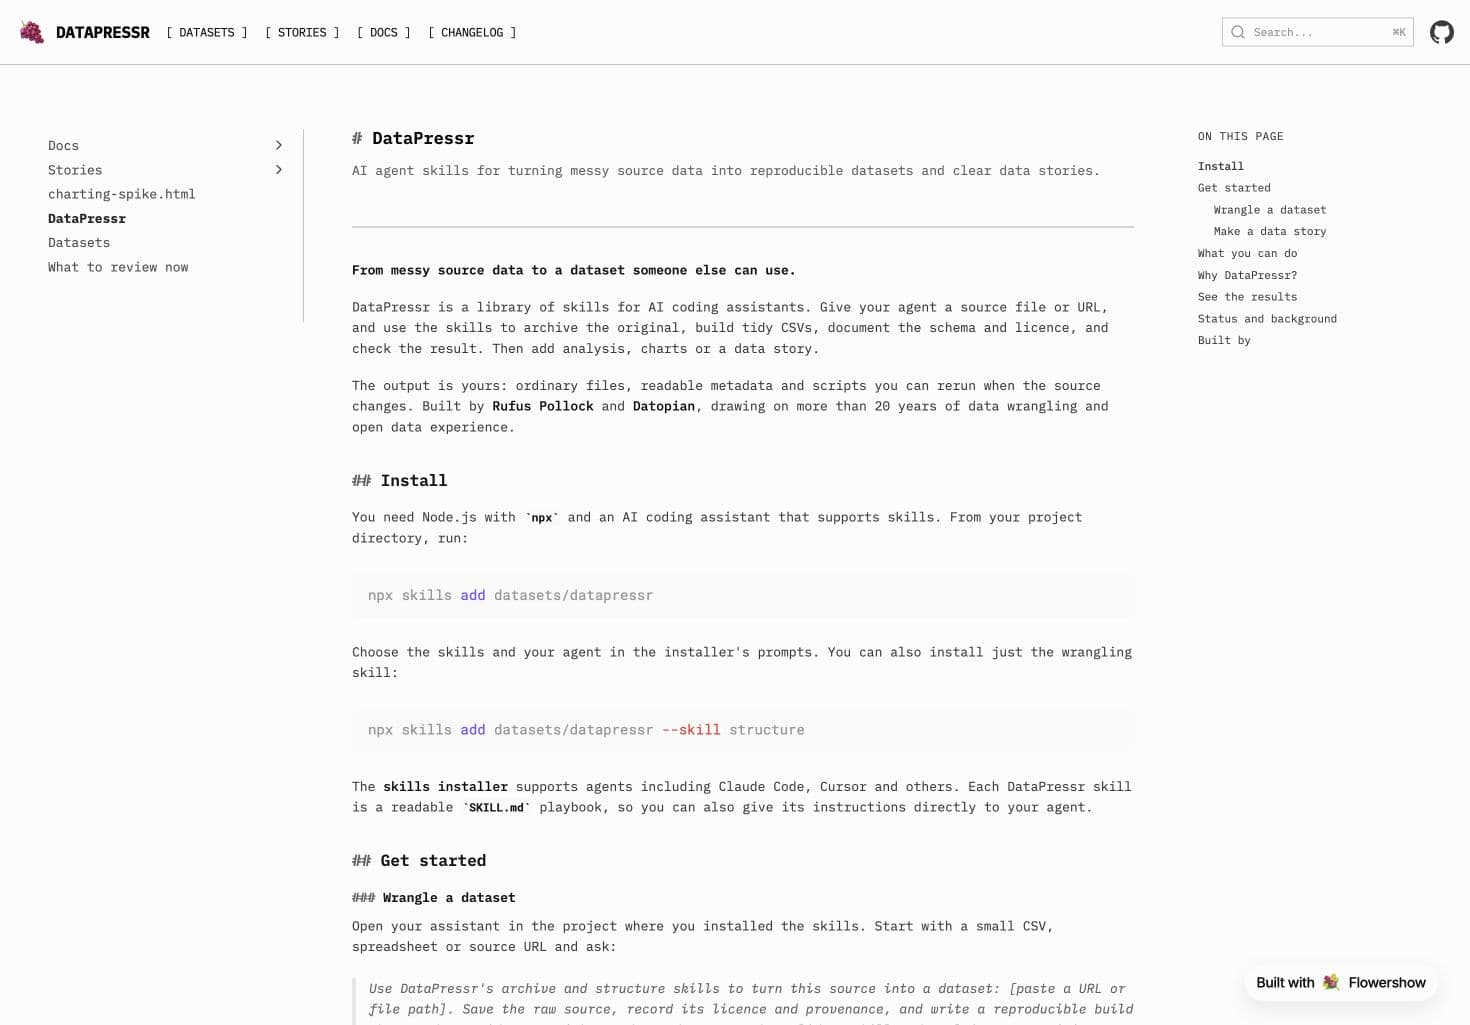
A clearer homepage and docs, in monospace
Install the skills, try a dataset or a data story, and see what the workflow produces.

Install the skills, try a dataset or a data story, and see what the workflow produces.
A new dataset: U.S. weather-related fatalities, injuries and damage by hazard type. 29 years, 1997 to 2025, from the National Weather Service's annual hazard summaries. Over the range the source counts 18,867 weather-related deaths: heat is the largest single cause at 5,366, ahead of tornadoes at 2,167 and flash floods at 2,015. The deadliest and costliest year is the same one, 2005.
Two things are worth knowing before anyone quotes it. Damage is in dollars of the year reported and is never inflation-adjusted. And a hurricane row counts wind only — the same storm's storm surge, rainfall flooding and tornadoes are filed under Flood and Tornado — so no row in the dataset is the full cost of a named storm. Neither fact is visible in the table; both are now in the dataset's own metadata.
This was the second run of the source-discovery playbook, and it was chosen to test the case the first one could not: a source with no machine-readable index at all. No API, no feed, no sitemap, no bulk download. The only listing of these 31 documents anywhere is a Dreamweaver-era drop-down menu on one page — and it offers a 1995 summary that the server does not have. That is the finding the run existed to produce: when the listing is typed by hand rather than generated from holdings, it can be wrong, so a 404 is data about the source rather than a failed fetch. All 31 candidates are published in a coverage table, the missing year and the 1996 document that turns out to be page images with no extractable text included.
Four other sources were probed and rejected first, and one rejection is worth recording. The Federal Reserve's economic projections were the best-shaped candidate found — no index, served reliably back to 2012 — and were dropped because no reuse statement for the Board's own material could be found: four likely terms pages all 404, and the one that exists talks only about other people's sites. A public-domain argument was available and was not taken; "arguable" is not "stated". The NWS says it in its own words, and that page is archived alongside the data.
The walkthrough records the route, including two bugs that reached the CSV and that no assertion caught: an event published for six years as River Flood}}, because a brace drawn beside the label was being read as part of it, and a coverage column that described every one of the 29 documents with the wrong layout. Both had correct numbers and wrong names — which is exactly what went wrong in the first run too. The playbook now says so plainly: arithmetic checks the figures, and nothing checks the labels except printing them and reading them.
An adversarial review then re-derived all 788 published values independently and found none of them wrong — and went on to find two ways the build could have been wrong without complaining, by breaking it on purpose. A row with no deaths, no injuries and little damage could be dropped entirely and every total would still reconcile; and swapping two column pairs across nineteen years left every sum, every count and the coverage table intact. Both are fixed, and the second produced the sharpest rule either run has yielded: every check the build had was derived from the extraction it was checking, so it moved with it. What catches that is a handful of figures read off the source by hand and typed in as literals.
On the question the playbook exists to settle — whether discovery should become a skill — the answer is still no, and now for a specific reason. The playbook asked for two more runs, one without an index and one where the licence does not resolve cleanly. The first is done. The second is not, and this run made its absence sharper by meeting a licence-ambiguous source and walking away from it rather than through it.
A no-break space or a zero-width space pasted into a regular expression is invisible in the editor, invisible in the diff and invisible in review — and if a later copy-paste flattens it to a plain space, the code still compiles and quietly stops matching the zero-width space, which \s does not cover. That bug was written twice here inside two days, and one of the two shipped. npm test now scans every .ts, .mjs, .js and .py file in the repo outside archive/ for literal invisible characters and fails with the file, the position and the escape to write instead; the structure skill carries the rule alongside the whitespace-trimming guidance it belongs with. Archived snapshots, published CSVs and the copied upstream issues are deliberately exempt: what a source actually said is evidence, not a defect.
The structure skill has told you since the value-semantics pass to trim every string you keep once, centrally, rather than per column when a mismatch surprises you — but the helper it named for the job did not exist. cleanString is now in the tested idioms module alongside cleanNumber and num: collapse whitespace runs, including the non-breaking and zero-width spaces HTML leaves behind, trim, and treat what's left of an empty cell as missing. It deliberately takes no placeholder list, because whether NA means "not applicable" is a fact about the row and not about the string, which is what the skill already says everywhere else.
The review that checked it found the skill's own evidence for the rule was stated backwards, and that is the more useful half of this note. The World Bank case is not that two regions' observation names are untidy; it is that four entity names in the metadata carry a trailing space while every observation name is clean, so for two of them the metadata disagrees with the entity's own data. Both the skill and the new docstring now say so. The review also drew the boundaries the helper needs: it does not decode HTML entities, it should not be pointed at text you mean to keep line-broken, and it has no business in a build that republishes a source's free text verbatim — airports carries 154 internal double spaces that are real differences, not mess.
Data story #3: WTI Went Negative. Brent Didn't. On 20 April 2020 the WTI spot price was -$36.98 a barrel, the only negative value in 25,415 Brent and WTI prices going back to 1986; Brent that day was $17.36. It is the first story written with the story skill as designed: outline, then an independent review, then charts, then prose. The review changed the argument. The first outline explained why WTI went negative, which a price-only dataset cannot show, and left out Brent falling to $9.12 the next day, two cents above its all-time low. The published story shows what the data shows and attributes the explanation to EIA and the CFTC. This corrects the 13 September outline entry, which presented the storage explanation as the finding. The author's voice pass is still to come.

The story and enrich skills are active. Both were drafted from hand-made examples and have now been through real runs: enrich on two datasets, story on three stories. Every open question in the drafts has a written policy based on those runs. Each skill now carries its guidance and a working starter script in its own folder, so npx skills add datasets/datapressr installs something usable outside this repository. That was checked with a clean install. Charts in stories use Observable Plot; charts on dataset pages use declarative views.
A new dataset: Tesla quarterly vehicle production and deliveries. 29 quarters, Q2 2019 to Q2 2026, by reported model group. What makes it worth a note is that the run started from a question — Tesla quarterly sales by vehicle over time — and no source. Tesla's own investor-relations site and the Business Wire copies of the press release both refuse plain HTTP clients; SEC EDGAR serves the identical Exhibit 99.1 as a public record, documents how it wants to be accessed, and publishes an index of its own filings, which is what makes the coverage auditable rather than merely plausible.
The question turned out not to be answerable as asked, and saying so is most of the value. Tesla reports production and deliveries as two separate measures, and reports grouped models rather than individual ones, with the grouping changing twice across the range. The dataset preserves those groups exactly as each release writes them and never splits or re-combines them. Three things the data turned up that the question did not anticipate: a dash that is a real zero (no Model S/X was built in Q1 2021), a total broken up by the page's own markup as 258,5 8 0, and full-year figures that do not reconcile with the four quarters as first reported — 2020 deliveries are 630 higher, 2021 are 222 higher, because Tesla restates without reissuing the releases. Both figures are published; the build prints the difference on every run rather than quietly picking one.
The 19 earlier releases, back to 2013, state their numbers in prose instead of a table. They are archived and listed as found-and-not-extracted rather than pulled out by one-off patterns whose failures would be silent. The walkthrough records the route, including the three bugs along the way — all three the same shape, a selection rule that returned fewer rows instead of an error.
The structure skill gained two sections, both from the second benchmark round. Joining tables says to write down cardinality and orphan policy before coding, and to assert one-side uniqueness, orphan counts and row counts rather than trusting them; the DuckDB threshold is reversed where the benchmark found it wrong, so a keyed many-to-one join across several files is now plain Node's job. Values that lie covers the two ways text misleads in opposite directions — placeholders that look like data, and real values like NA for North America or Namibia that every default CSV reader treats as missing.
The structure skill has now been tested on the two source shapes it hadn't seen: a paginated JSON API and a join across several linked tables. Each run produced a new dataset.
NA here means North America or Namibia, not missing, so tools that read NA as blank will drop real values.Both met every hard bar on the first build. The benchmark write-up lists three gaps in the skill. The JSON/API guidance has already been added to the skill; the other two are queued.
Story #3 outline: "WTI Went Negative. Brent Didn't." The outline argues from a single finding surfaced by the oil-prices enrich rep: of 25,415 observations across all eight Brent/WTI series, exactly one is negative — WTI's -$36.98 on 2020-04-20 — while Brent, priced the same day, held at $17.36. The wrinkle is structural, not accidental: WTI settles at landlocked Cushing, Oklahoma, Brent on seaborne cargoes that can be redirected when storage tightens. Every number in the outline is checked directly against the underlying CSVs. Awaiting outline review (#10's sign-off step) before any prose is written.
Keeling curve charts moved to Observable Plot, replacing the original hand-rolled SVG generator and bringing story #1 in line with the charting decision story #2 already uses. The 350 ppm and 400 ppm reference lines are now computed from the plotted annual series itself rather than hardcoded, and labelled as annual-mean crossings (1988, 2015) — the well-known 1986 and 2013 dates mark the first single month above each threshold, a materially different fact from the annual mean this chart shows. The monthly/seasonal chart now marks the year's actual high and low (May and September) directly on the line.
Following last week's relocation of this repo's own Project Drawdown dataset to datasets/project-drawdown, a second, unrelated Project Drawdown dataset turned up living inside datasets/climate-and-environment — same name, same GitHub org, different everything else. The comparison finds they're genuinely different products (2020's two-scenario Table of Solutions vs. 2024's richer, Explorer-based classification) rather than duplicates, and that only the 2024 one is actually published on DataHub. It also surfaces something worth a second look: the 2024 dataset states its licence as CC-BY-4.0, but a direct check of Project Drawdown's own terms of use turns up no such statement — the recommendation is to keep both datasets, cross-link them, and get that licence claim traced to an actual source before treating it as settled.
oil-prices moved structured → enriched, the second hand rep of the draft enrich skill (co2-ppm was the first). Its eight Brent/WTI series all share one measurement (Price), so this rep consolidates them into a single stats table keyed by resource + measurement instead of eight near-identical ones — resolving the "parallel resources" open question the skill draft left for exactly this case. The stats confirm the 2020-04-20 negative WTI spot price (-$36.98) survives the pipeline intact and washes out once averaged into the weekly/monthly/annual series, and that Brent and WTI both peaked on the same day, 2008-07-03. Along the way a stale view titled "Brent vs WTI" that only plotted one resource got split into two honest single-series views. enrich.ts ships with 19 tests covering empty/missing/zero/negative/constant inputs and byte-for-byte preservation of hand-written commentary across reruns.
 Flowershow